Colors View
The colors sidebar has two sub tabs Histogram and ICC Profile, which are described here. More complete information on color management within digiKam is available in the Color Management chapter of this manual.
Visualizador do Histograma
The Histogram Viewer shows the statistical distribution of color values in the current image. It is purely informational – nothing you do with it will cause any change to the image. A histogram-based color correction can be performed using the Color Balance, Levels Adjust or Curves Adjust features in the Image Editor.
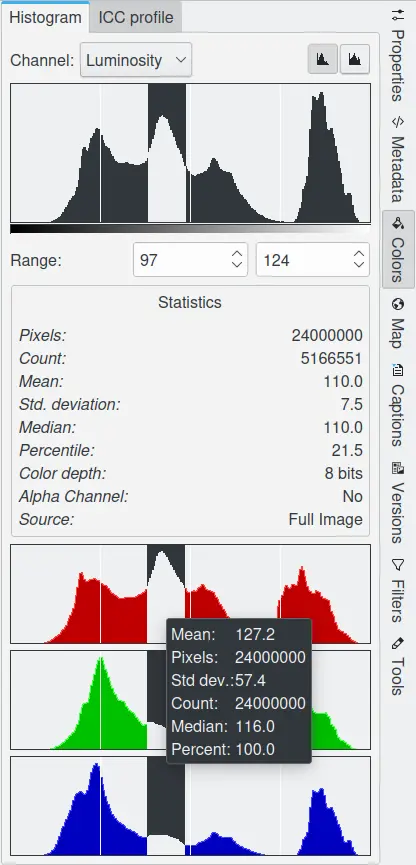
A Área de Cores na Barra Lateral Direita a Mostrar a Informação do Histograma
Color images can be decomposed into Red, Green and Blue color channels. Some images also include an Alpha channel that supports transparency (like PNG or GIF images). Each channel supports a range of intensity levels from 0 to 255 (integer valued). Thus, a black pixel is encoded by 0 on all color channels; a white pixel by 255 on all color channels. A transparent pixel is encoded by 0 on the alpha channel; an opaque pixel by 255.
O Visualizador do Histograma permite-lhe ver cada um dos canais em separado:
a Luminosidade mostra a distribuição dos valores de brilho.
Vermelho, Verde, Azul: mostra a distribuição dos níveis de intensidade para os canais Vermelho, Verde ou Azul, respectivamente.
Alfa: mostra a distribuição dos níveis de opacidade. Se a camada for completamente opaca ou completamente transparente, o histograma irá consistir numa única barra do lado esquerdo ou direito.
Cores: mostra os histogramas do Vermelho, Verde e Azul sobrepostos, para que possa ver toda a distribuição de cores numa única área.
With the Scale option you can determine whether the histogram will be displayed using a linear or logarithmic vertical axis. The Linear mode is usually the most useful for images taken with a digital camera. However, a Linear histogram for images that contain substantial areas of constant color will often be dominated by a single bar. In this case a Logarithmic histogram may be more useful.
You can restrict the analysis of the Statistics field shown in the middle of the dialog to a limited range of values by setting the minimum and maximum range in one of two ways:
Click and drag the pointer across the desired range span within the histogram display area.
Use the spin button fields below the histogram area. The left entry is the minimum range and the right entry is maximum range.
The statistics shown in the middle of the Histogram Viewer describe the distribution of channel values, restricted to the selected range. These are:
O número de pontos na imagem.
The number of pixels whose values fall within the selected range.
The mean of the pixels within the selected range.
The standard deviation of the pixels within the selected range.
The median of the pixels within the selected range.
The percentage of pixels whose values fall within the selected range.
A profundidade de cor da imagem.
Is there an alpha channel in the image?
The source of the histogram, either Full Image, or Image Region if you have selected an area of the image within the Image Editor.
How To Use a Histogram
Histograms are a graphical means to assess the color and tonal qualities of an image shown on the screen. The graph can be divided into 3 regions of photographic brightness:
: the shadows on the left of the histogram.
: the mid-tones in the middle.
: the highlights on the right of the histogram.
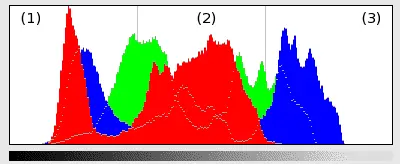
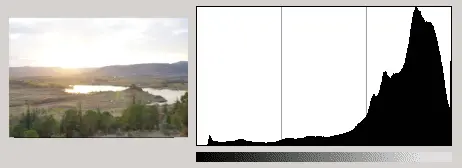
Um Histograma da Imagem no Modo de Todas as Cores
The spread of the histogram, and where the spikes and bulges are clustered, indicates whether the image is too dark, too bright, or well-balanced.
The histogram for an under exposed photograph will have a distribution of brightness that tends to be mostly on the left of the graph.
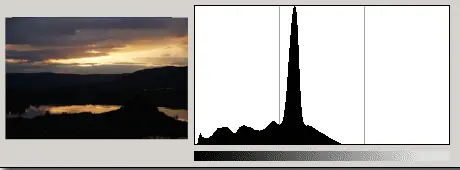
Uma Fotografia Sub-Exposta
The histogram for a correctly exposed photograph will have a distribution of brightness that will be most prominent near the center part of the graph.
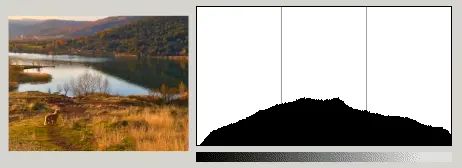
Uma Fotografia Devidamente Exposta
The histogram for an over exposed photograph will have the bulge showing the brightness distributed mostly towards the right of the graph.
Uma Fotografia Sobre-Exposta
Importante
Nem todas as fotografias têm de exibir este desnível ao centro do seu histograma. Muito dependendo do assunto da fotografia. Em alguns casos, poderá ser apropriado para o histograma mostrar um pico num extremo, no outro ou em ambos.
The histogram is a reliable way of deciding whether or not a photograph is correctly exposed. Should the histogram show an over or under exposure, it may be possible to fix the photograph using the Exposure Correction Tool.
Visualizador do Perfil ICC
An ICC profile is a set of data that characterizes a color input or output device, or a color space, according to standards promulgated by the International Color Consortium. Profiles describe the color attributes of a particular device, or the viewing requirements for a particular image, by defining a mapping between the device source or target color space and a device-independent color space called the profile connection space. Mappings may be specified using tables, to which interpolation is applied, or through a series of parameters for transformations used in Color Management.
Every image file can be profiled. Camera manufacturers provide profiles for their products, and store them in image files as extra metadata. This ICC Profile viewer displays the textual information for the image’s color profile and a chromaticity diagram indicating the image’s color gamut.
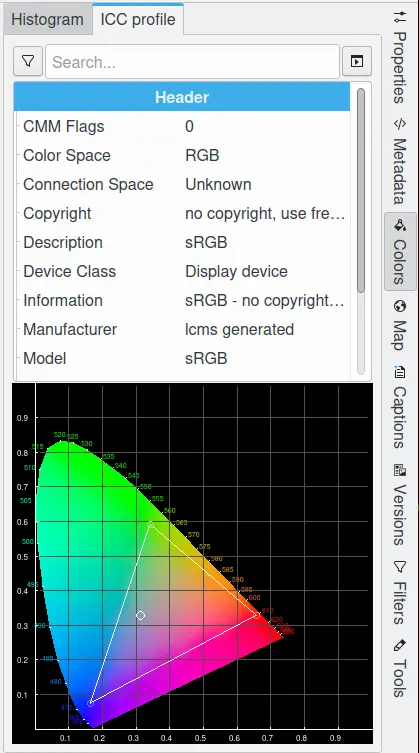
A Área de Cores da Barra Lateral Direita a Mostrar Informações do Perfil de Cores